

Riffing on themes: CRE dispersed, China swallows biotech, and the wealth effect is fake
7 charts on various things big and small

We’re entering earnings season, so try to stay focused on some random riffs on themes:
historically dispersed outcomes for CRE or why ‘location location location’ is no longer the name of the game (and maybe never was)
‘skull graph’ realized for earlier stage biotech companies (that are all Chinese)
‘excess savings’ are back, and why the ‘wealth effect’ is bogus (conjecture)
👉👉👉Reminder to sign up for the Weekly Recap only, if daily emails is too much. Find me on twitter, for more fun. 👋👋👋Random Walk has been piloting some other initiatives and now would like to hear from broader universe of you:
(1) 🛎️ Schedule a time to chat with me. I want to know what would be valuable to you.
(2) 💡 Find out more about Random Walk Idea Dinners. High-Signal Serendipity.Riffing on themes: CRE, China biotech, and ‘excess savings’ or contra the wealth effect
Random Walk was flu-ridden for a couple of days, but I’m back in the saddle with some riffs on themes.
Historically dispersed
Random Walk has previously referred to the “tale of two real estates.”
The observation was specific to office buildings, where demand for newer, nicer offices was actually pretty good, while demand for everything else was really pretty bad:

Demand for newer assets is very strong. Everything else, not so much.
The discrepancy shows up in office occupancy, as well:
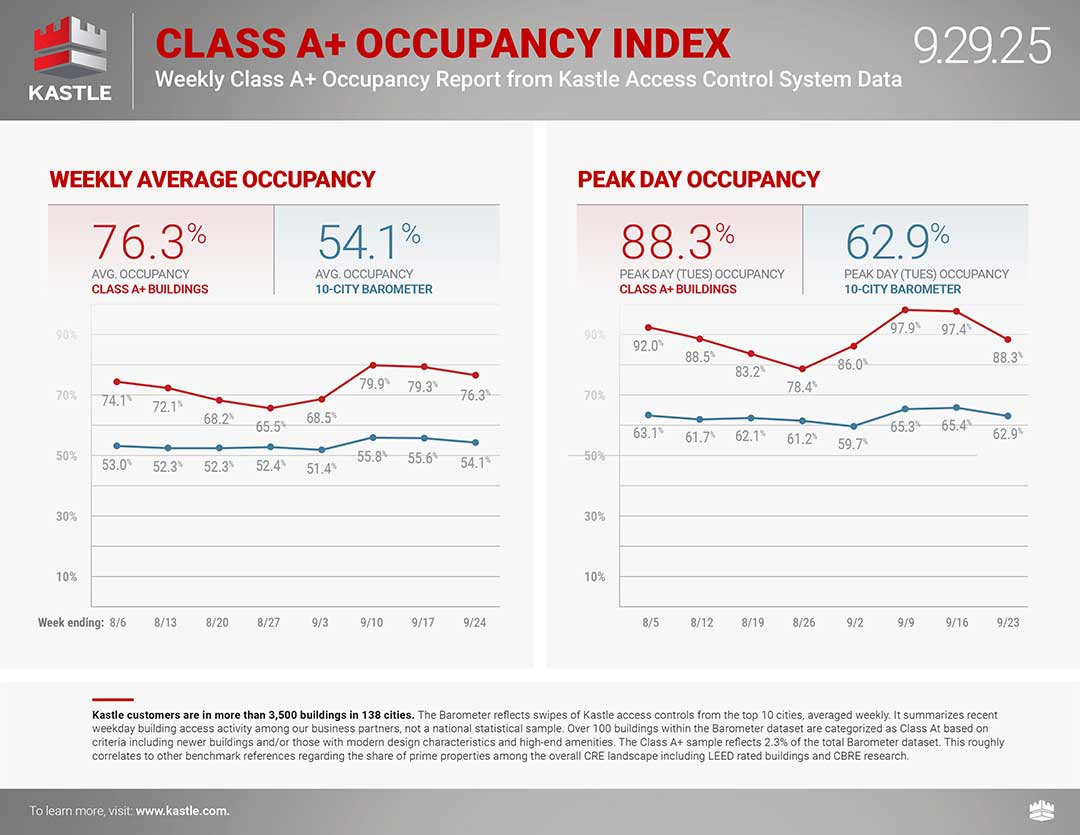
Class A+ buildings are running well-ahead of the field, when it comes to actually having bodies in the buildings.
Anyways, that tale of two real estates is definitely still the case with respect to Office buildings, but little did I know that it generalizes to real estate, more broadly.
It turns out that the gap between the best- and worst-performing sectors and markets has never been higher:
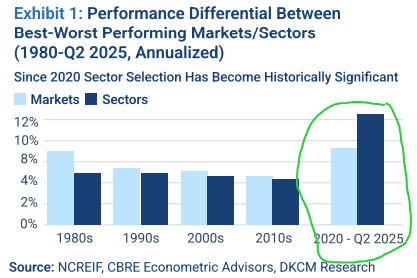
The best-performing markets have out-performed by 8%, while the best-performing sectors have out-performed by ~12%—both of which represent the highest outcome dispersions since the 80’s.
Not only have the haves outpaced the have-nots by record spreads, but there’s another historical inversion: usually markets, i.e. location, explain more of the out-performance. This time, however, it was strategy.
Picking the right asset to build mattered more than picking the right place to build it. So much for location, location, location.
The analysis is actually very interesting throughout, filled with market- and asset-specific data, but to summarize the overall takeaway: it’s not just rates that changed the game, but major structural changes to both supply and demand.
Capital, labor and supplies all got more expensive;
remote work and urban decay (plus cost-cutting) shifted office (and residential) demand; while
ecommerce and data centers have put a premium on fulfillment and industrial
The net result is a high concentration of outsized gains for specific asset-types in specific markets, which DK expects to continue, moving forward.
There’s a deeper lesson here that the days of “everything up and to the right” are over, and investing is getting hard again.
ICYMI


China swallows biotech (reprise)
Last month, Random Walk stumbled upon the ‘skull-graph.’
